Manish Gupta

Principal Consultant at Wipro Limited
Data Scientist | ML | DL | NLP | GenAI
Email: mgupta.power@gmail.com
View My LinkedIn Profile
View My Tableau Profile
View My Kaggle Profile
Read my articles on Medium
About me:
I am a Data Scientist with about 6 years of dedicated experience in AI, Machine Learning, Deep Learning, and Natural Language Processing. My journey in data science has allowed me to lead and implement cutting-edge solutions in various domains, including Generative AI, Chatbot development, and NLP.
Prior to transitioning into data science, I accumulated over a decade of experience in the Power, Energy, and Infrastructure sectors, focusing on business development, tendering, and bid management. This background provides me with a unique perspective on solving complex business challenges through data-driven insights and AI technologies.
Currently, I am a Principal Consultant - Technology & Implementation at Wipro, where I specialize in developing AI/ML solutions that drive innovation and efficiency. I am always eager to collaborate on impactful projects that leverage my expertise in data science and AI.
Core Competencies:
- Digital Transformation
- Data Science
- Machine Learning
- Deep Learning
- Natural Language Processing
- Computer Vision
- Reinforcement Learning
- Generative AI
- Scrum Master / Agile
Skills:
- Languages: Python, R Programming
- Database: MySQL, SQLite
- Dashboarding & Data Visualization: Tableau
- Deep Learning framework: TensorFlow, Keras
- GenAI: Transformer, Large Language Models, Multimodal, Retrieval Augmented Generation (RAG)
- AI Platforms: Google Generative AI Studio, Google Vertex AI, Nuance Mix, Domino Data Lab - Modelmaker, Dataiku
- Python Web framework: Flask, Django
- Cloud: GCP, AWS
- Containerization: Docker
- Automation: Microsoft Flow
- AI-Assisted Development: GitHub Copilot
- CI/CD Pipeline: GitHub Actions, GitLab
- Other: HTML, Webscrapping
Certifications:
- PGP in Data Science from Purdue University in Collaboration With IBM (Simplilearn Certified)
- AWS Certified Cloud Practitioner
- Google Digital Cloud Leader
- Google Associate Cloud Engineer
- Google Cloud GenAI - L1, L2, L3
- DeepLearning.AI TensorFlow Developer
- Coursera Deep Learning Specialization
- Coursera Natural Language Processing Specialization
- Coursera (University of Alberta) - Reinforcement Learning Specialization
- Dataiku Certifications - Core Designer, ML Practitioner, Advanced Designer
- Nuance Certification - Nuance Mix for Partners, Nuance Digital Engagement Platform for Partners
Data Science/ AIML Projects
Note: The projects listed below include both academic projects from my Post Graduate Program in Data Science and personal projects I have undertaken to further hone my skills. Due to confidentiality agreements and the sensitive nature of professional client projects, I am unable to share specific details here. However, I would be happy to discuss my expertise and experience in more detail during a professional conversation.
Project No. 1: HEALTHCARE PGP (BINARY CLASSIFICATION)
Model deployed at: https://python-flask-ml.herokuapp.com/
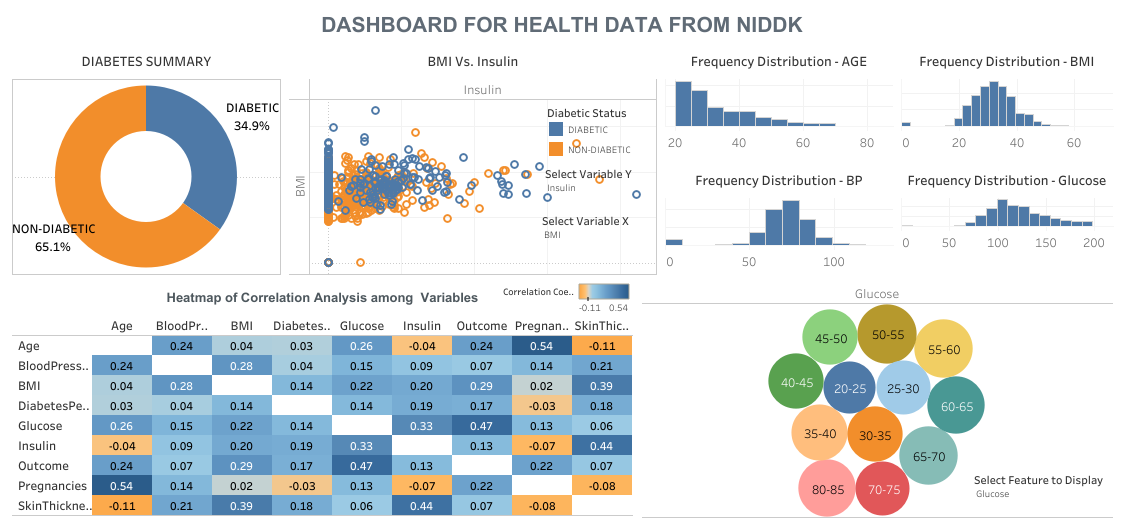
Introduction: NIDDK (National Institute of Diabetes and Digestive and Kidney Diseases) research creates knowledge about and treatments for the most chronic, costly, and consequential diseases. The dataset used in this project is originally from NIDDK. The objective was to predict whether or not a patient has diabetes, based on certain diagnostic measurements included in the dataset.
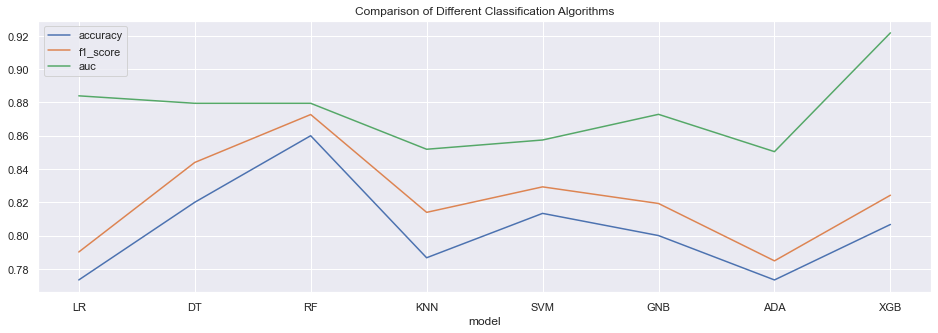
Objective: This is my first capstone project and was part of the final assessment for PGP in Data Science course from Simplilearn-Purdue University. My task was to analyze patients data from NIDDK which consists of several medical predictor variables and one target variable (Outcome). Predictor variables includes the number of pregnancies the patient has had, their BMI, insulin level, age, and more. I created and trained multiple machine learning models using various classification algorithms. Then all models were compared to evaluation their metrics on given data. Finally model was deployed on heroku.
I performed following tasks in this project:-
- Data Cleaning
- Data Transformation
- Data Modeling - various classification model
- Data Modeling - performance evaluation using various metrics
- Data Reporting - dashboarding in tableau
- Model Deployment - finally model deployed on heroku.
Tools used: Python, Pandas, Numpy, Logistic Regression, Decision Tree, Random Forest, KNN, SVM, Gradient Boosting, Scikit-learn, Matplotlib, Seaborn, Data Preprocessing, Data Transformation, Flask, Tableau.
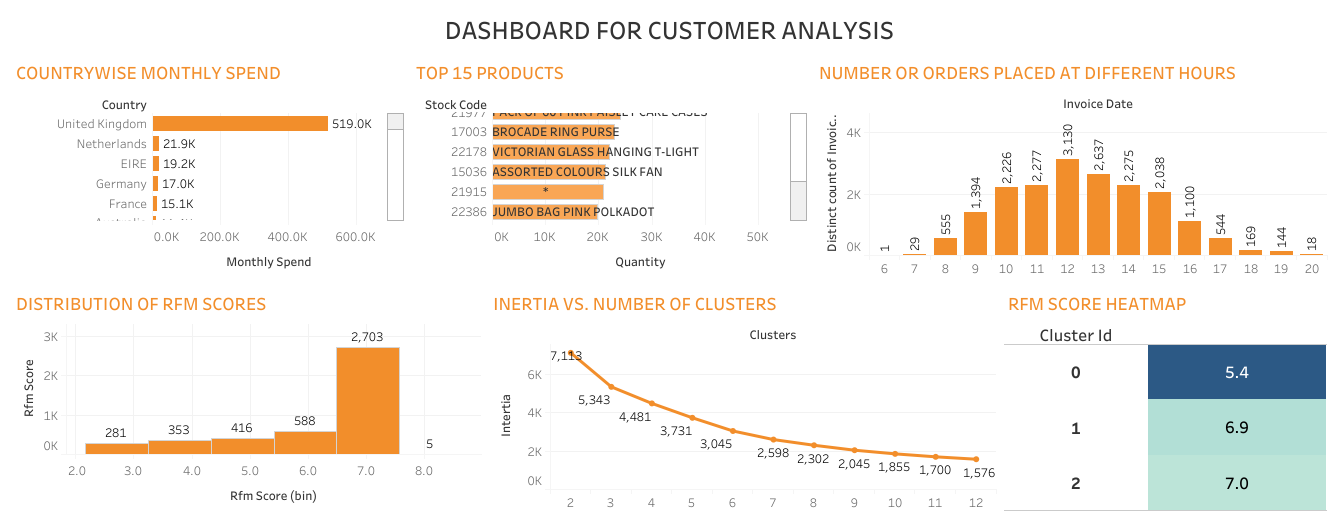
Project No. 2: RETAIL PGP (CUSTOMER SEGMENTATION)
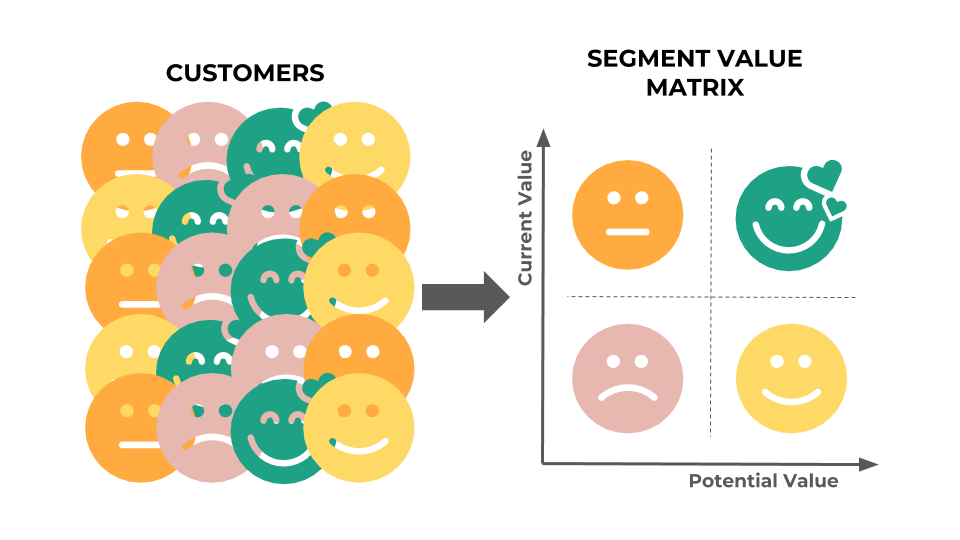
Introduction: Customer segmentation is the practice of segregating the customer base into groups of individuals based on some common characteristics such as age, gender, interests, and spending habits. It is a way for organizations to understand their customers. Knowing the differences between customer groups, it’s easier to make strategic decisions regarding business growth and marketing campaigns. Implementing customer segmentation leads to plenty of new business opportunities and business can do a lot of optimization in budgeting, product design, promotion, marketing, customer satisfaction etc. The opportunities to segment are endless and depend mainly on how much customer data you have at your use. There are many machine learning algorithms, each suitable for a specific type of problem. One very common machine learning algorithm that’s suitable for customer segmentation problems is the k-means clustering algorithm which I have used for this project. There are other clustering algorithms as well such as DBSCAN, Agglomerative Clustering, and BIRCH, etc.
Objective: This is my second capstone project and was part of the final assessment for PGP in Data Science course from Simplilearn-Purdue University. My job was to analyze transactional data for an online UK-based retail company and create customer segmentation so that company can create effective marketing campaign. This is a transnational data set which contains all the transactions that occurred between 01/12/2010 and 09/12/2011. The company mainly sells unique and all-occasion gifts.
I performed following tasks in this project:-
- Data Cleaning
- Data Transformation
- Data Modeling - RFM (Recency Frequency Monetary) model
- Data Modeling - K-means clustering algorithm
- Data Reporting - Dashboarding in tableau
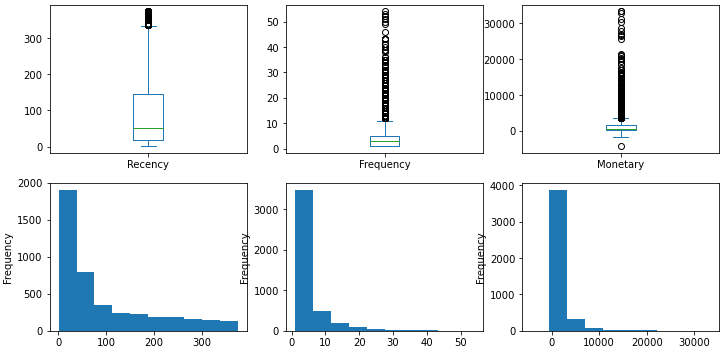
K-means clustering, an unsupervised algorithms, is one of the techniques that are useful for customer segmentation. The basic concept underlying k-means is to group data into clusters that are more similar.
Tools used: Python, Pandas, Numpy, K-means clustering, Scikit-learn, Matplotlib, Seaborn, Data Preprocessing, Data Transformation, Tableau.
My Data Science Portfolio
Assignments & Coursework:
Project No. 1: TEXT GENERATION USING DEEP LEARNING
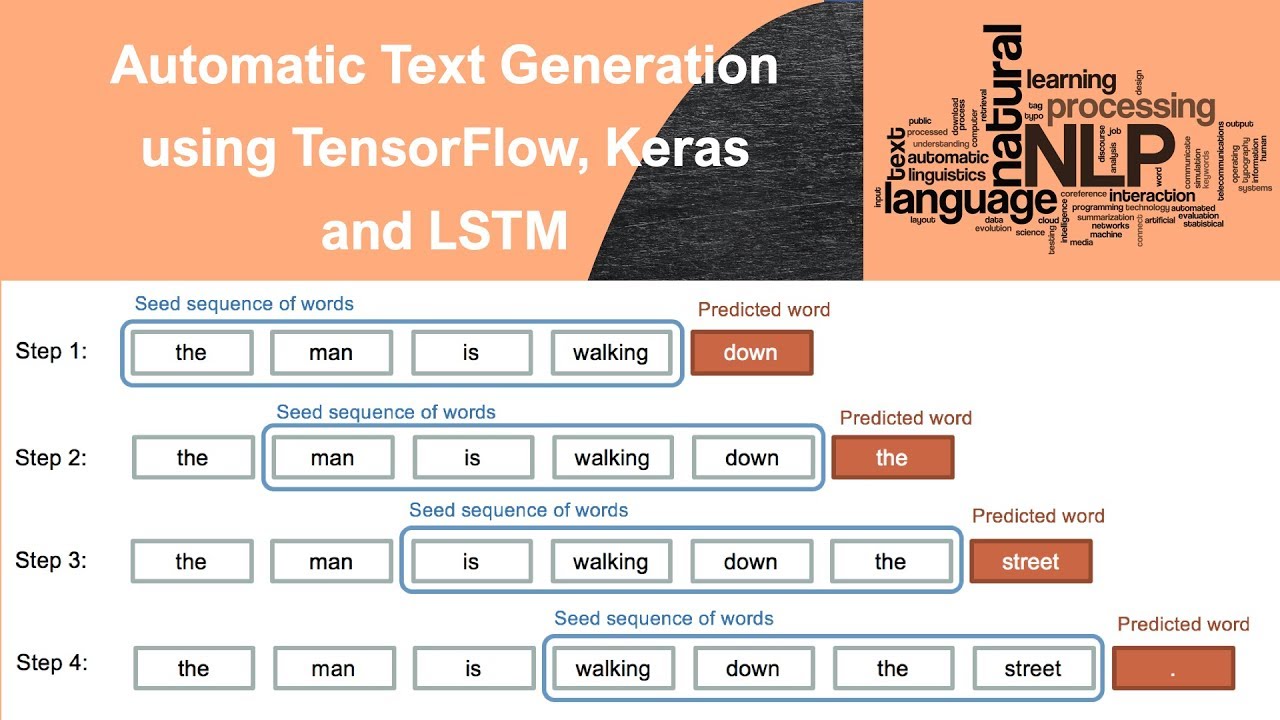
Introduction: Deep Learning is the most exciting part of Data Science and the next stage after learning Machine Learning. I have worked on this project titled “Text Generation Using Deep Learning” to apply my Deep Learning for solving a major problem in Natural Language Processing known as Language Modeling. I used Keras library to create Recurrent Neural Network model and train it with our dataset to predict text for headline.
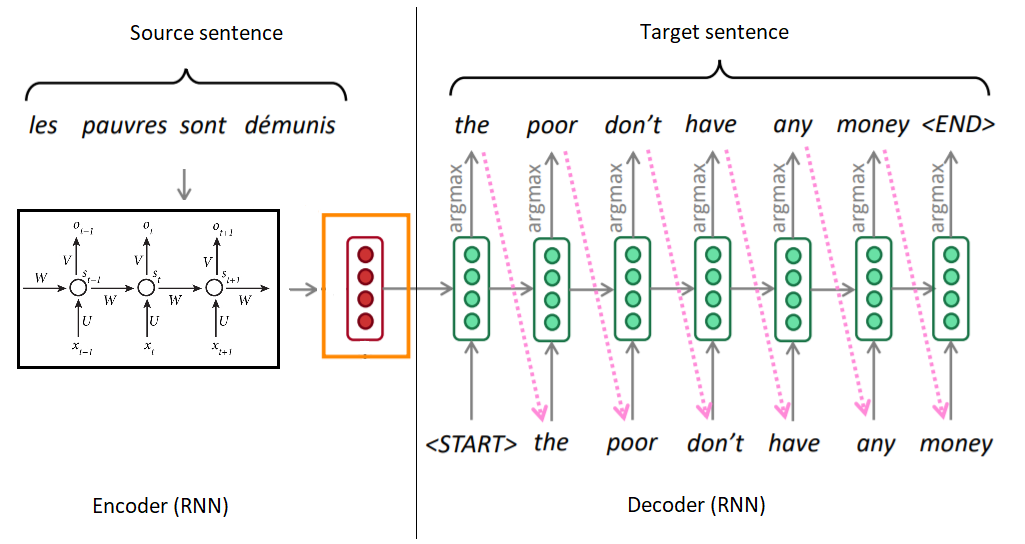
Objective: Language Modelling is the core problem for a number of of natural language processing tasks such as speech to text, conversational system, and text summarization. A trained language model learns the likelihood of occurrence of a word/ character based on the previous sequence of words/ characters used in the text. Language models can be operated at character level, n-gram level, sentence level or even paragraph level. We will create a language model for predicting next word by implementing and training state-of-the-art Recurrent Neural Networks under Deep Learning.
Tools used: Python, Pandas, Numpy, NLP, Deep Learning, Tensorflow Keras, Recurrent Neural Network (RNN), Long Short Term Memory networks (LSTM).
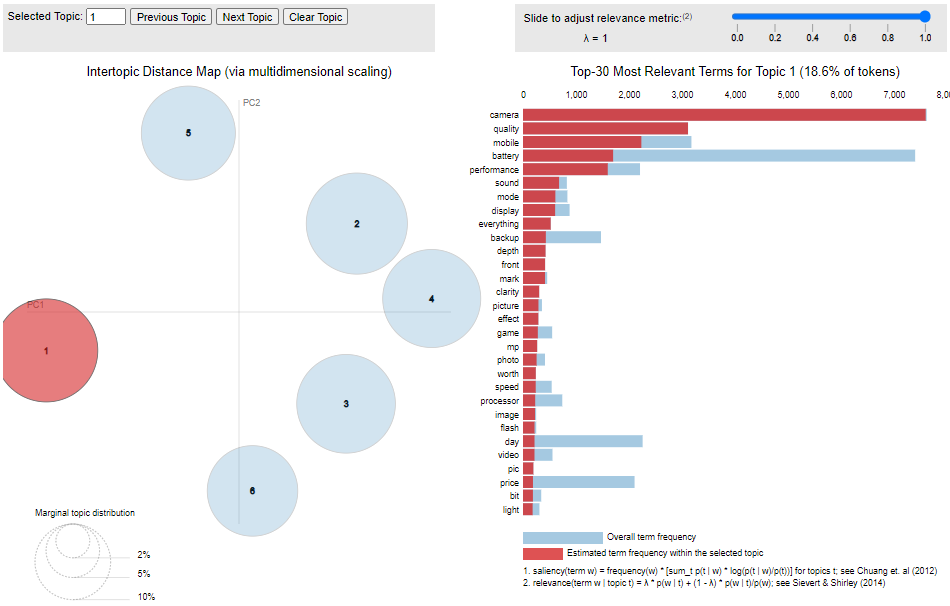
Project No. 2: TOPIC MODELING
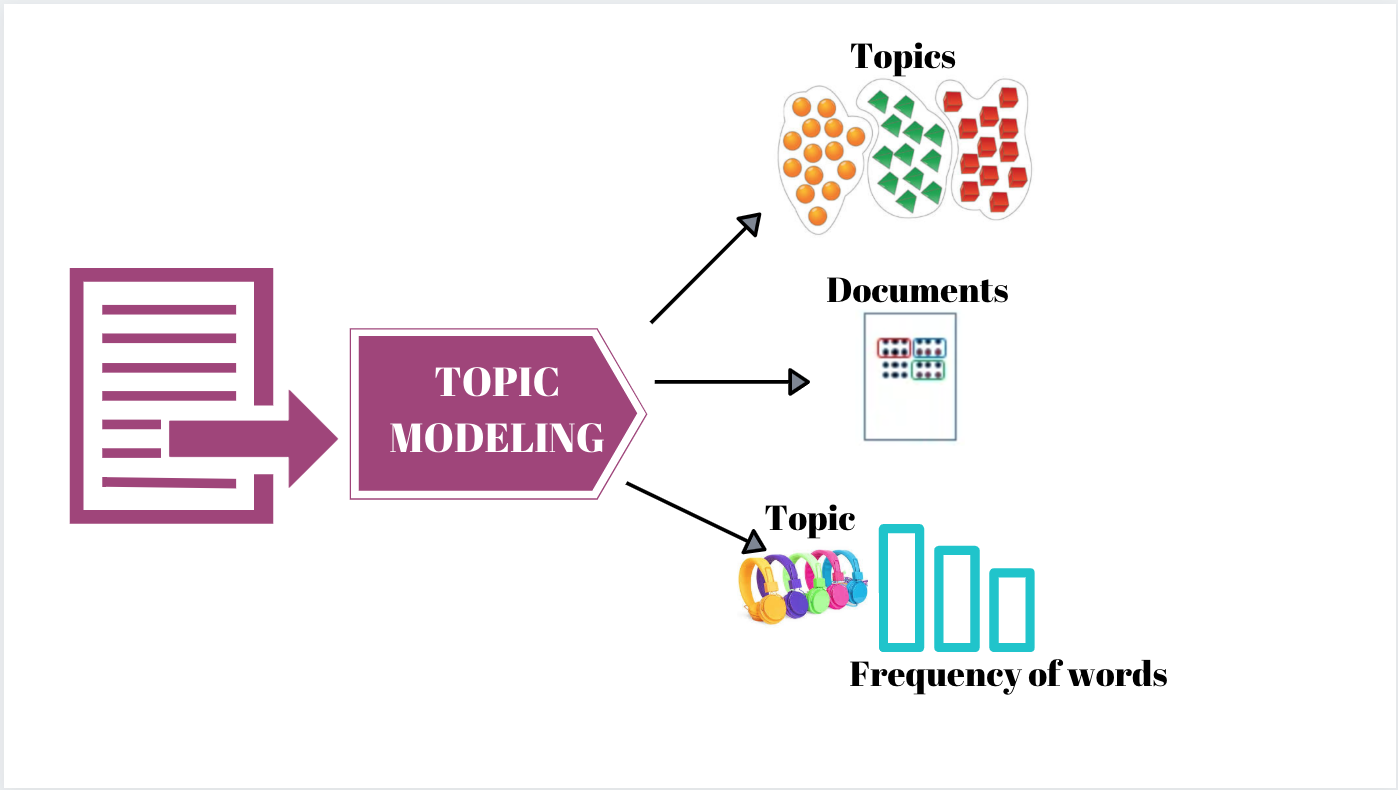
Introduction: I have worked on this project titled “Topic Modeling” to fulfil mandatory criteria towards “Natural Language Processing” module of my PGP in Data Science course from Simplilearn. I used NLTK library to perform various text preprocessing, POS tagging, Lemmatization and Gensim Library to create LDA model for topic identification and finally pyLDAvis to visualize model created.
Objective: A popular mobile phone brand, Lenovo has launched their budget smartphone in the Indian market. The client wants to understand the VOC (voice of the customer) on the product. This will be useful to not just evaluate the current product, but to also get some direction for developing the product pipeline. The client is particularly interested in the different aspects that customers care about. Product reviews by customers on a leading e-commerce site should provide a good view. Perform analysis by POS tagging, topic modeling using LDA, and topic interpretation.
Tools used: Python, Pandas, Numpy, Regular Expression, NLTK, POS Tagging, Lemmatization, Gensim, LDA, pyLDAvis.
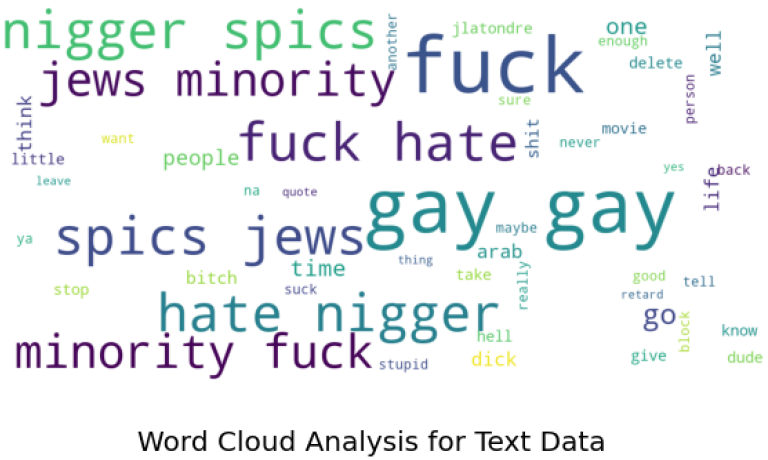
Project No. 3: WIKIPEDIA TOXICITY
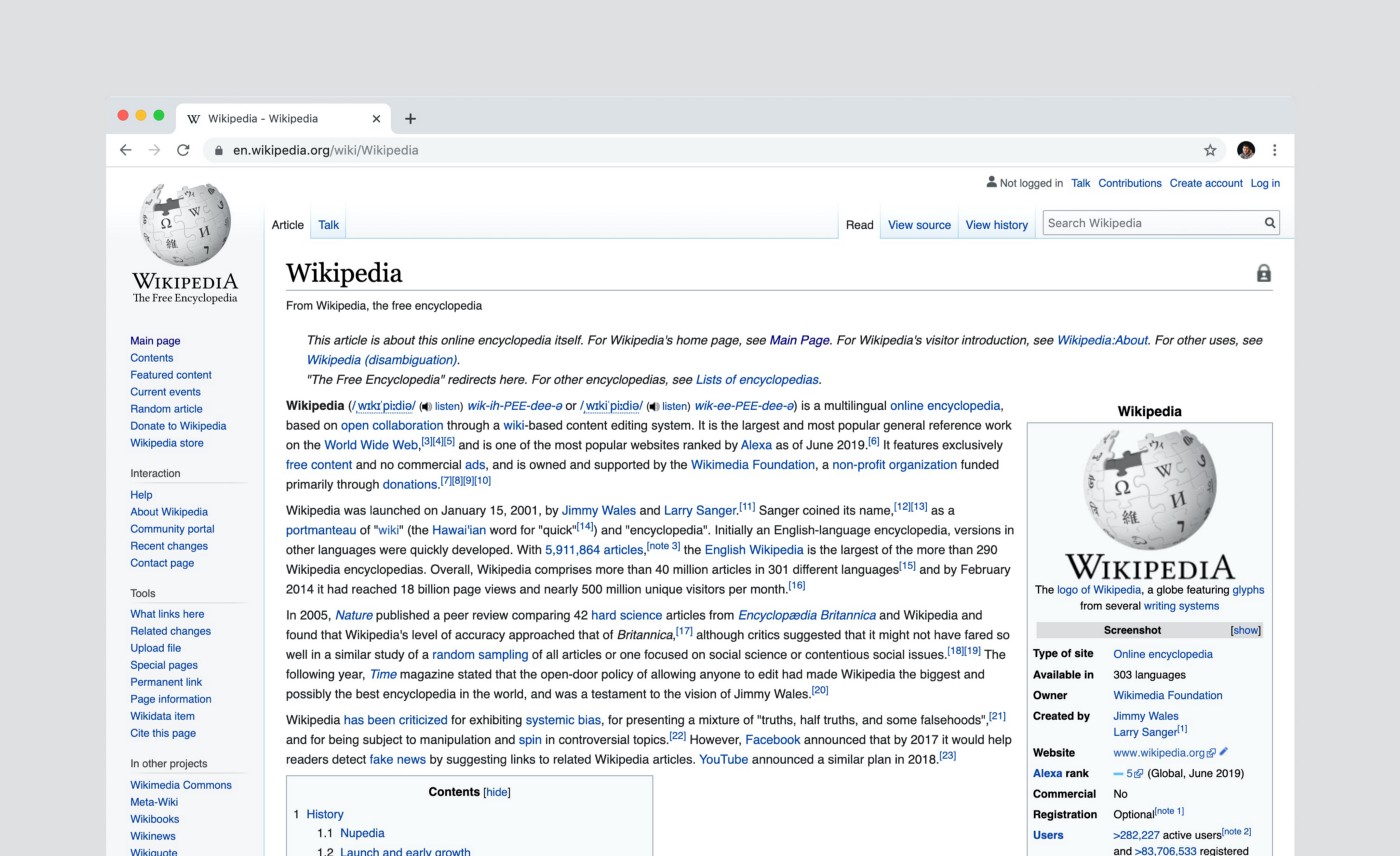
Introduction: I have worked on this project titled “Wikipedia Toxicity” to fulfil mandatory criteria towards “Natural Language Processing” module of my PGP in Data Science course from Simplilearn. I performed text preprocessing using various functions such RegEx, Tokenization, Stopwords and Punctuation removals followed by domain stopwords removal and Lemmatization. I also performed Class balancing since datapoints in target variable were imbalanced. Hyperparameter tuning using GridSearch and StratifiedKFold was done to optimize model. SVM Classifier from Scikit-learn library was used to train model with train data and then prediction on test data.
Objective: Wikipedia is the world’s largest and most popular reference work on the internet with about 500 million unique visitors per month. It also has millions of contributors who can make edits to pages. The Talk edit pages, the key community interaction forum where the contributing community interacts or discusses or debates about the changes pertaining to a particular topic. Wikipedia continuously strives to help online discussion become more productive and respectful. My task was to help Wikipedia to build a predictive model that identifies toxic comments in the discussion and marks them for cleanup by using NLP and machine learning. Post that, help identify the top terms from the toxic comments.
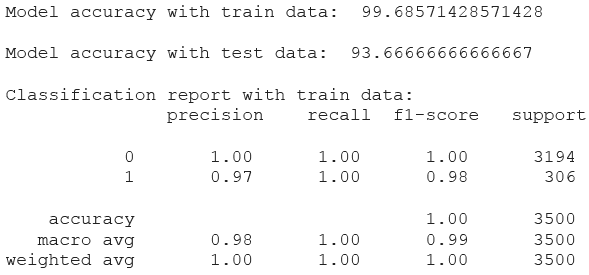
Tools used: Python, Pandas, Numpy, WordCloud, Regular Expression, NLTK, TfidfVectorizer, Scikit-learn, Support Vector Machine (SVM), Hyperparameter tuning using GridSearch and StratifiedKFold
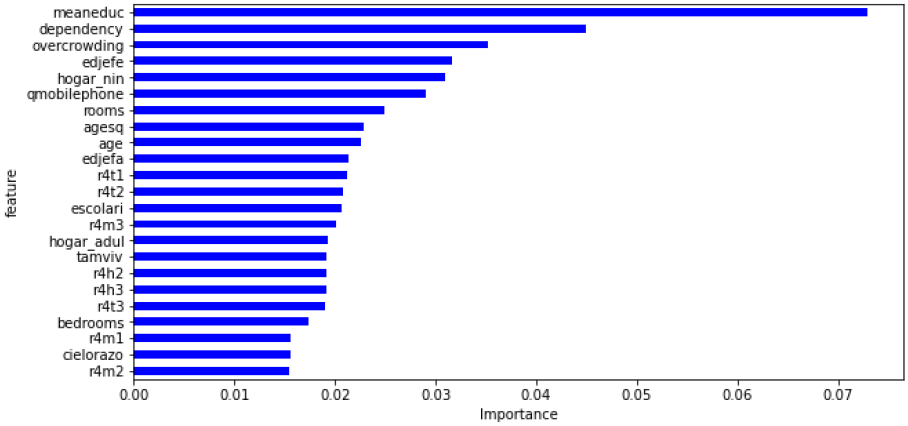
Project No. 4: INCOME QUALIFICATION

Introduction: I have worked on this project titled “Income Qualification” to fulfil mandatory criteria towards “Machine Learning” module of my PGP in Data Science course from Simplilearn. I used RandomForestClassifier in Python to create model for predicting income level and used GridSearchCV to improve model performance. I also used Matplotlib and Seaborn to visualize data.
Objective: Many social programs have a hard time ensuring that the right people are given enough aid. It’s tricky when a program focuses on the poorest segment of the population. This segment of the population can’t provide the necessary income and expense records to prove that they qualify. The Inter-American Development Bank (IDB) believes that new methods beyond traditional econometrics, based on a dataset of Costa Rican household characteristics, might help improve PMT’s performance. My task was tTo identify the level of income qualification needed for the families for social welfare program in Latin America using given dataset.
Tools used: Python, Pandas, Numpy, Matplotlib, Seaborn, RandomForest Classifier, GridSearchCV.
Project No. 5: COMCAST TELECOM CONSUMER COMPLAINTS
Introduction: I worked on this project titled “Comcast Telecom Consumer Complaints” to fulfil mandatory criteria towards “Data Science with Python” module of my PGP course from Simplilearn. I did not create any machine learning model in this project. I performed data analysis in python using various tools such as Pandas, Numpy, Matplotlib, Seaborn, Worldcloud.
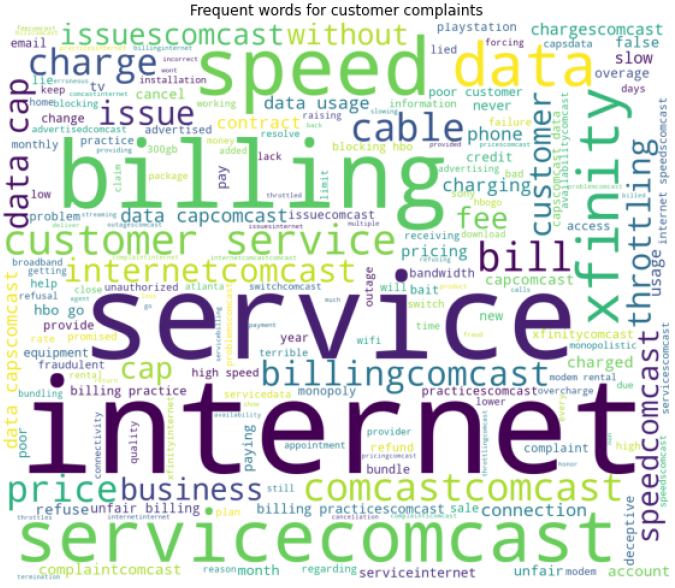
Objective: Comcast is an American global telecommunication company. The given dataset serves as a repository of public customer complaints filed against Comcast. My task was to analyse given data and provide the trend chart for the number of complaints at monthly/ daily granularity levels and present further insight.
Tools used: Python, Pandas, Numpy, Matplotlib, Seaborn, Worldcloud.
Project No. 6: RETAIL ANALYSIS WITH WALMART DATA
Introduction: I worked on this project titled “Retail Analysis with Walmart Data” to fulfil mandatory criteria towards “Data Science with R” module of my PGP course from Simplilearn. I have created Linear Regression model using R programming language in this project. I performed hypothesis testing and statistical analysis in R using various libraries in R.

Objective: Walmart is one of the leading retail stores in the US. The business was facing a challenge due to unforeseen demands and would run out of stock sometimes. My task was to predict the sales and demand accurately. There are certain events and holidays which impact sales on each day. The sales data is available for 45 stores of Walmart. Walmart runs several promotional markdown events throughout the year. These markdowns precede prominent holidays, the four largest of all, which are the Super Bowl, Labour Day, Thanksgiving, and Christmas. The weeks including these holidays are weighted five times higher in the evaluation than non-holiday weeks. Part of the challenge faced in this project was modelling the effects of markdowns on these holiday weeks in the absence of complete/ideal historical data. My Machine Learning algorithm will predict demand accurately and ingest factors like economic conditions including CPI, Unemployment Index, etc.
Tools used: R programming language, dplyr, tidyr.
Stand-alone Projects:
Replicating Research:
Project No. 1: STOCKS MARKET TRADE DATA ANALYSIS

Objective: I was given a dataset (570 rows × 6 columns) containing historical trade details such as entry price, exit price, p&l and some technical indicators like atr_perc, roc and rsi. Objective was to analyze dataset in python and try to find best range of atr_perc , roc , rsi so that the sum of P&L is maximized for the range of values for atr_perc , roc , rsi.
Solution:
Indicator …….. Min. Value …….. Max. Value
- RSI …….. 58.02 …….. 89.72
- ATR_perc …….. 0.274223035 …….. 0.427709112
- ROC …….. -77.72927145 …….. 2633.788326
Final P&L if we take entry only when given technical indicators were within above range: Rs. 65773
Time taken by program to process complete data and generate output: 2.03 seconds
Blogs & Vlogs:
GRAPHICAL VISUALIZATION OF LINKEDIN NETWORK
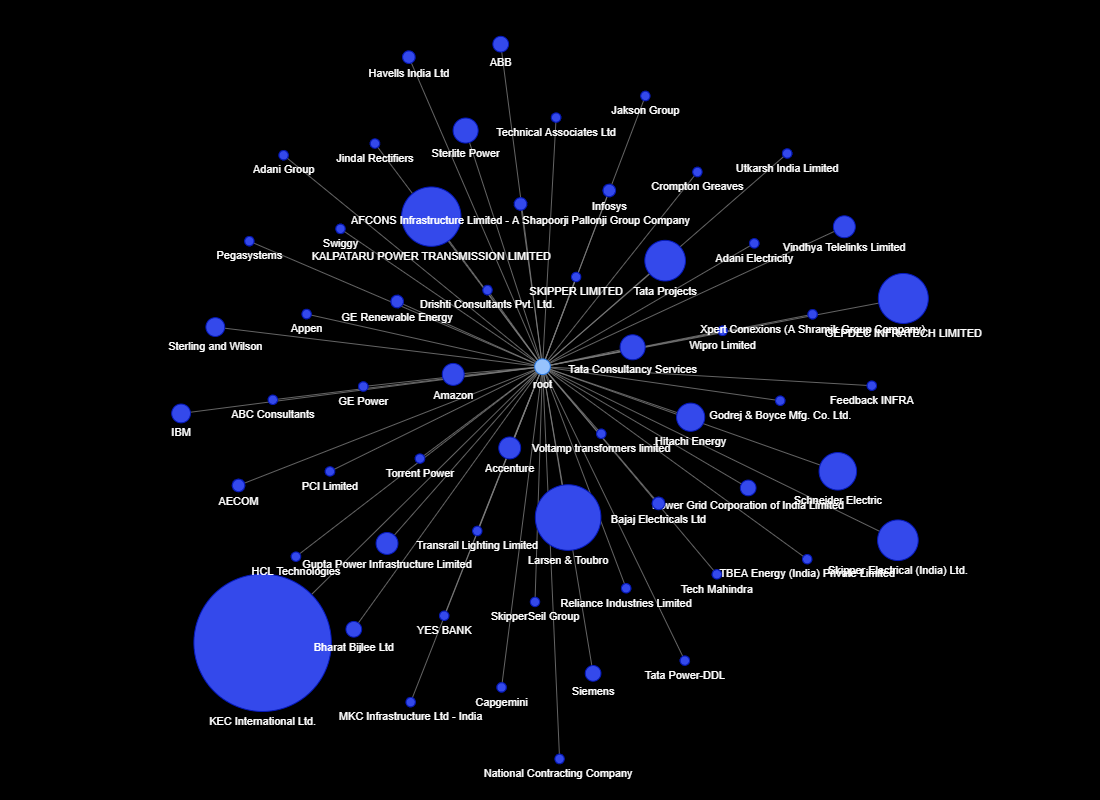

Introduction: We all use LinkedIn to make connections with professionals in our industry or even from any other industry too. On LinkedIn, we see only a list of our connections, so it’s hard to visualize the entire network of your connections. I tried to apply my python skill in Data Science to explore my connections on LinkedIn and find out some interesting information and visualize it in the form of interactive graphs.
Checkout following links to see interactive graphs showing details of my LinkedIn connections:-
Companies of my LinkedIn connections: https://datapane.com/u/mgupta/reports/J35lWVA/linkedin-connection-company/
Positions of my LinkedIn connections: https://datapane.com/u/mgupta/reports/j3LQnv7/linkedin-connection-positions/
Competitions:
Copyright (c) Manish Gupta