Manish Gupta

Principal Consultant at Wipro Limited
Data Scientist | ML | DL | NLP | GenAI
Email: mgupta.power@gmail.com
View My LinkedIn Profile
View My Tableau Profile
View My Kaggle Profile
Read my articles on Medium
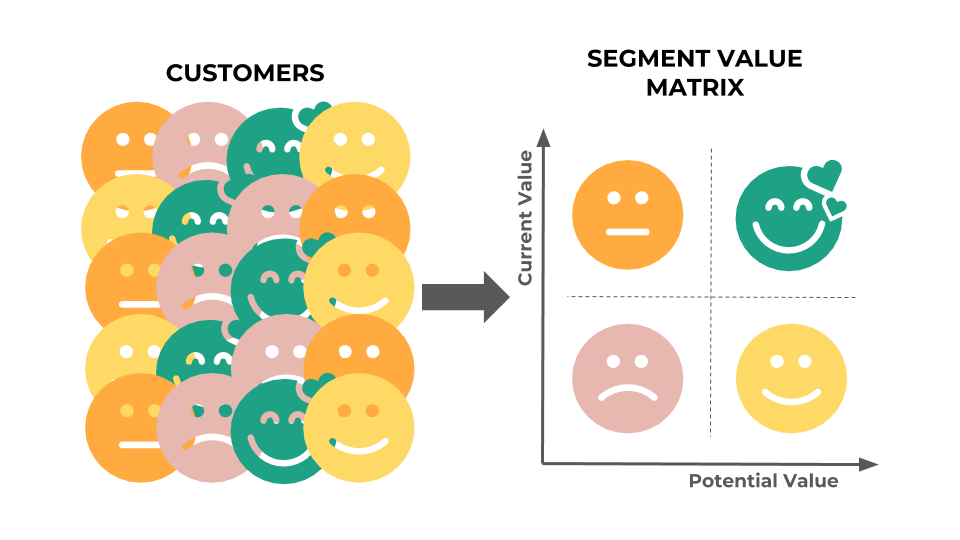
CUSTOMER SEGMENTATION
Introduction: Customer segmentation is the practice of segregating the customer base into groups of individuals based on some common characteristics such as age, gender, interests, and spending habits. It’s a way for organizations to understand their customers. Knowing the differences between customer groups, it’s easier to make strategic decisions regarding business growth and marketing campaigns. Implementing customer segmentation leads to plenty of new business opportunities and business can do a lot of optimization in budgeting, product design, promotion, marketing, customer satisfaction etc. The opportunities to segment are endless and depend mainly on how much customer data you have at your use. Machine learning methodologies are a great tool for analyzing customer data and finding insights and patterns. Artificially intelligent models are powerful tools for decision-makers. They can precisely identify customer segments, which is much harder to do manually or with conventional analytical methods. There are many machine learning algorithms, each suitable for a specific type of problem. One very common machine learning algorithm that’s suitable for customer segmentation problems is the k-means clustering algorithm which I have used for this project. There are other clustering algorithms as well such as DBSCAN, Agglomerative Clustering, and BIRCH, etc.
Objective: This is my first capstone project and was part of the final assessment for PGP in Data Science course from Simplilearn-Purdue University. My job was to analyze transactional data for an online UK-based retail company and create customer segmentation so that company can create effective marketing campaign. This is a transnational data set which contains all the transactions that occurred between 01/12/2010 and 09/12/2011. The company mainly sells unique and all-occasion gifts.
I performed following tasks in this project:-
- Data Cleaning
- Data Transformation
- Data Modeling - RFM (Recency Frequency Monetary) model
- Data Modeling - K-means clustering algorithm
- Data Reporting - Dashboarding in tableau
K-means clustering, an unsupervised algorithms, is one of the techniques that are useful for customer segmentation. The basic concept underlying k-means is to group data into clusters that are more similar.
Problem Statement: It is a critical requirement for business to understand the value derived from a customer. RFM (Recency, Frequency, Monetary) is a method used for analyzing customer value. Perform customer segmentation using RFM analysis.
Data Cleaning:
- Perform a preliminary data inspection and data cleaning. a. Check for missing data and formulate an apt strategy to treat them. b. Remove duplicate data records. c. Perform descriptive analytics on the given data.
Data Transformation:
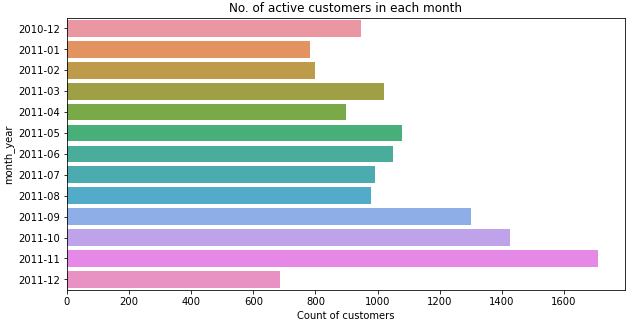
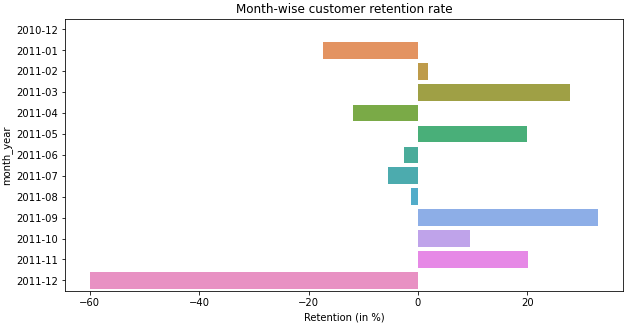
- Perform cohort analysis (a cohort is a group of subjects that share a defining characteristic). Observe how a cohort behaves across time and compare it to other cohorts. a. Create month cohorts and analyze active customers for each cohort. b. Analyze the retention rate of customers.
Data Modeling-I:
- Build a RFM (Recency Frequency Monetary) model.
- Calculate RFM metrics.
- Build RFM Segments. Give recency, frequency, and monetary scores individually by dividing them into quartiles. b1. Combine three ratings to get a RFM segment (as strings). b2. Get the RFM score by adding up the three ratings. b3. Analyze the RFM segments by summarizing them and comment on the findings.
Data Modeling-II:
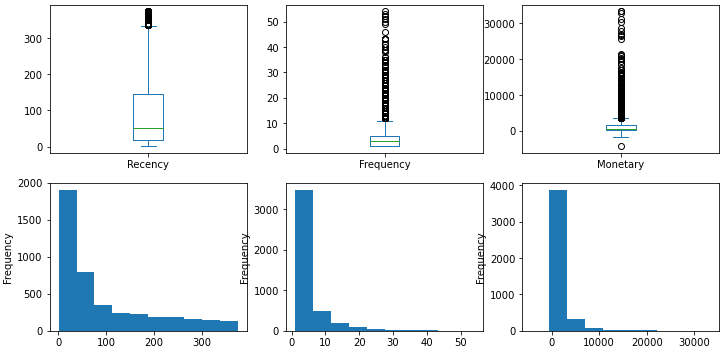
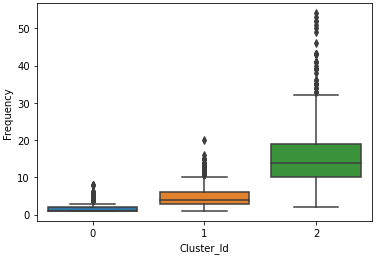
- Create clusters using k-means clustering algorithm. a. Prepare the data for the algorithm. If the data is asymmetrically distributed, manage the skewness with appropriate transformation. Standardize the data. b. Decide the optimum number of clusters to be formed. c. Analyze these clusters and comment on the results.
Data Reporting:
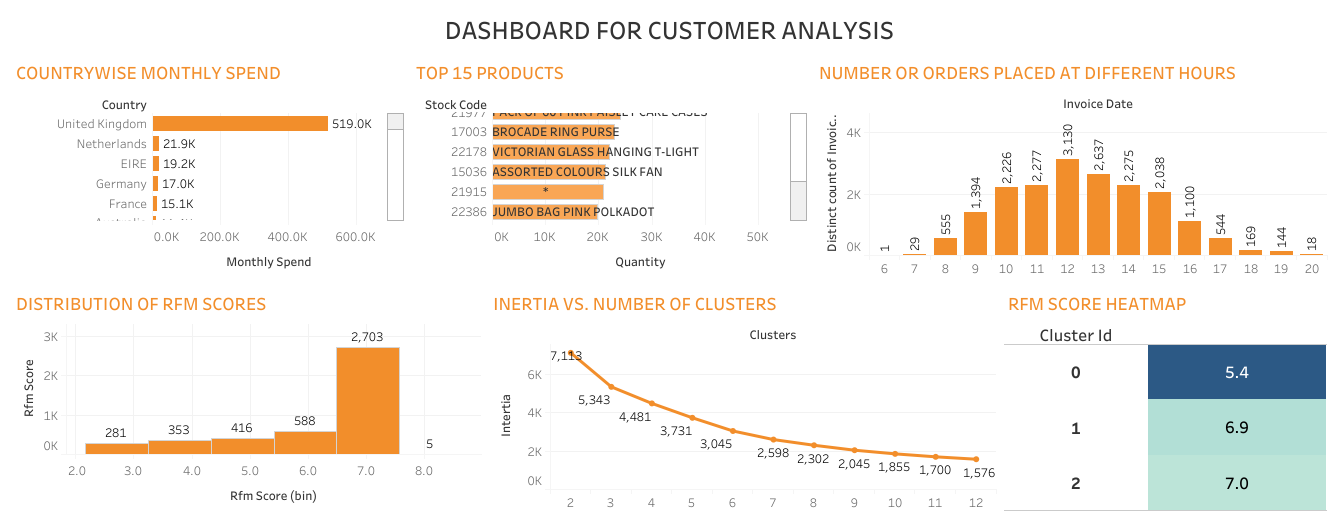
- Create a dashboard in tableau by choosing appropriate chart types and metrics useful for the business. The dashboard must entail the following: a. Country-wise analysis to demonstrate average spend. Use a bar chart to show the monthly figures b. Bar graph of top 15 products which are mostly ordered by the users to show the number of products sold c. Bar graph to show the count of orders vs. hours throughout the day d. Plot the distribution of RFM values using histogram and frequency charts e. Plot error (cost) vs. number of clusters selected f. Visualize to compare the RFM values of the clusters using heatmap
Tools used: This project was done in Python language and popular libraries like Pandas, Numpy, Matplotlib, Seaborn, K-means clustering and Scikit-learn were used in this project for Data Preprocessing and Data Transformation. Finally dashboard was created in Tableau for visualizations.
Copyright (c) Manish Gupta